Which Industry Has the Best Performance Improvement Initiatives?
Industry Initiatives
Every industry has some type of initiative to improve performance. For example:
- Manufacturing (especially the auto industry) adopted Lean Manufacturing (the Toyota manufacturing system) as a common way to improve performance.
- Aviation has long had initiatives to prevent accidents and improve flight safety.
- The nuclear industry created the Institute of Nuclear Power Operations to spread best practices across the industry and improve nuclear plant safety and efficiency.
- The chemical industry created the Center for Chemical Process Safety to develop best practices and share them among its members.
- The healthcare industry has several professional organizations with the stated purpose of improving patient safety.
And that’s just a start.
Interestingly, these various initiatives aren’t the same. There may be similar ideas in some of the initiatives, but, in general, each has its own unique flavor.
Why are these performance improvement initiatives different? Read on for some ideas and ideas on how you can learn from all the different initiatives.
Variation Among Improvement Initiatives
Of course, at least some of the variation in improvement initiatives has to do with the technology and risks inherent in each industry:
- Flying is different than building a car.
- Running a refinery is different from running an emergency room.
- You can’t simply shut off a nuclear plant (you must deal with decay heat) like you can gas-fired power plants.
- Driving a train is different than ensuring the security of a computer system.
The differences in the hazards faced and the safeguards each industry develops influence the initiatives developed to improve performance. Some hazards are so extreme that companies use multiple redundant safeguards to avoid accidents.
However, every industry has certain similarities that should contribute to similarities in their improvement programs. For example:
- All industries (at least for now) have human beings as operators, mechanics, supervisors, and managers.
- All industries have resource limitations and competing priorities.
- Many industries have similar risk types (working at heights, electrical hazards, heavy objects, high-pressure piping, hazardous chemicals, moving objects, sharp edges, pinch points, …).
Considering these differences and similarities, one might wonder which industry has the best (and perhaps the worst) performance improvement initiative.
How Does Your Industry Rate?
When it comes down to which improvement initiative is the best, probably the only way to compare industries is by performance. How well did they meet their goals?
For example, the US Nuclear Navy’s goal is zero reactor accidents. That can be measured by seeing if they have had any core melt accidents or significant accidental releases of contamination. What is their record? Zero core melt accidents or significant accidental releases of radiation in the program’s history. That’s running hundreds of reactors from the 1950s to date. That’s an amazing accomplishment directly related to the programs Admiral Rickover put in place starting in the 1950s.
Commercial Nuclear Industry
How about the commercial nuclear industry? In the US, there has been one significant core melt accident. That was the accident at Three Mile Island in 1979. Since the improvement initiatives that started after that accident, there have been no accidents in the US commercial nuclear industry.
However, there have been two major accidents elsewhere in the world.
First, there was the 1986 destruction of the Chernobyl Reactor 4 in the USSR and the significant release of radiation that impacted much of Europe.
Second was the earthquake, tsunami, and core melt of the reactors at Fukushima in Japan.
These two accidents prove that learning in the nuclear industry has not been accomplished evenly around the world. This lack of worldwide learning in an industry is probably common in all industries, not just the nuclear industry.
What about other industries? Let’s look at three.
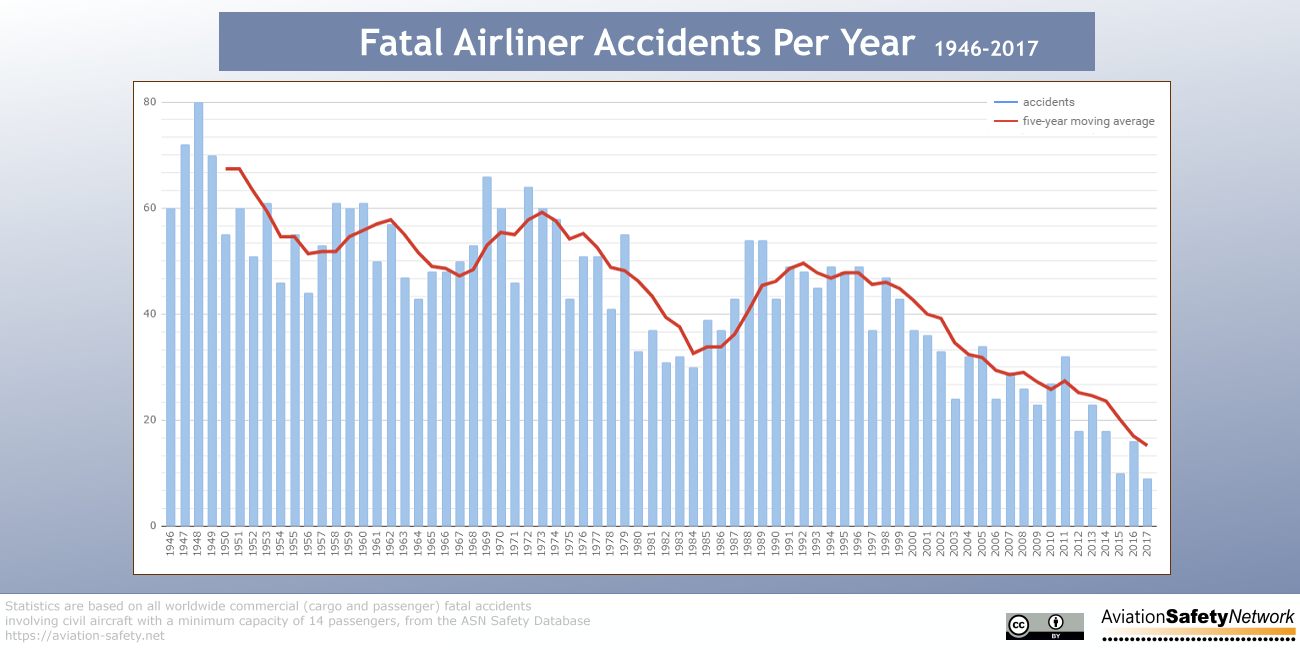
Commercial Aviation
Obviously, the goal in the commercial aviation industry is zero crashes and zero passenger fatalities. Significant progress has been made over the years. The graph below from the Aviation Safety Network shows the progress from 1946 to 2017.
Here’s another graph (by Airbus) of commercial aviation accidents per million commercial departures by aircraft generation.

The graph above shows that the more modern aircraft have much better safety performance. However, the graph below shows that the improvement in human factors has not been as rapid as in technical factors.

And 2024 was a challenging year.
Thus, even with modern aircraft, a goal of zero has not yet been achieved.
Chemical/Oil Industry
It is difficult to find consistent chemical/oil industry accident statistics. One reason is that industrial and process safety incidents may or may not be separately counted. Thus, industrial safety incidents may obscure trends in process safety incidents (or vice versa). Also, injuries are not consistently counted the same around the world (for example, what constitutes a lost-time accident varies from country to country).
However, when asking AI to describe a chemical industry accident rate graph, it replied with…
A “chemical industry accident rate graph” would typically show a downward trend over time, indicating a decrease in the number of accidents per worker within the chemical manufacturing sector, with the y-axis representing the accident rate (often calculated as incidents per 100 workers) and the x-axis representing time periods (e.g., years).
A document from Frankenmuth Insurance listed the following top ten industries with the highest workplace fatality rates as of 2022:
- Petrochemical, upstream, onshore – 9.8 fatalities per 100,000 workers per year
- Petrochemical, midstream (pipelines) – 9.1 fatalities per 100,000 workers per year
- Utilities, distribution and power generation – 7.7 fatalities per 100,000 workers per year
- Construction – 7.5 fatalities per 100,000 workers per year
- Food and Beverage – 7 fatalities per 100,000 workers per year
- Paper, Packaging, and Building Products – 6.6 fatalities per 100,000 workers per year
- Petrochemical, upstream, offshore – 6.4 fatalities per 100,000 workers per year
- Petrochemical, downstream – 6.2 fatalities per 100,000 workers per year
- Chemical – 6.1 fatalities per 100,000 workers per year
- Transportation – 6 fatalities per 100,000 workers per year
Thus, the data provided by ISN Software Corporation from an article published by Frankenmuth Insurance puts the chemical/oil industry at number 1, 2, 7, 8, and 9 in the list above. This is certainly not a ranking one would want to achieve. And even though AI says the rates are decreasing, they certainly aren’t zero or close to zero.
Hospital/Healthcare
This may be the worst example. Let’s start by noting that there are no consistent reports on the number of healthcare-related fatalities due to sentinel events (medical errors). Estimates of the number of fatalities in the US caused by medical errors range from 44,000-98,000 to 220,000 deaths per year, and an estimate that 440,000 patients experience some form of preventable harm at hospitals (from the Journal of Patient Safety). And the estimates have not been going down since the first estimate in 1999 by the Institute of Medicine.
We wrote about this poor performance in 2013 and updated and republished our opinions in 2023. See what we had to say HERE.
The healthcare industry is nowhere near the goal of “first do no harm.”
What Can You Do?
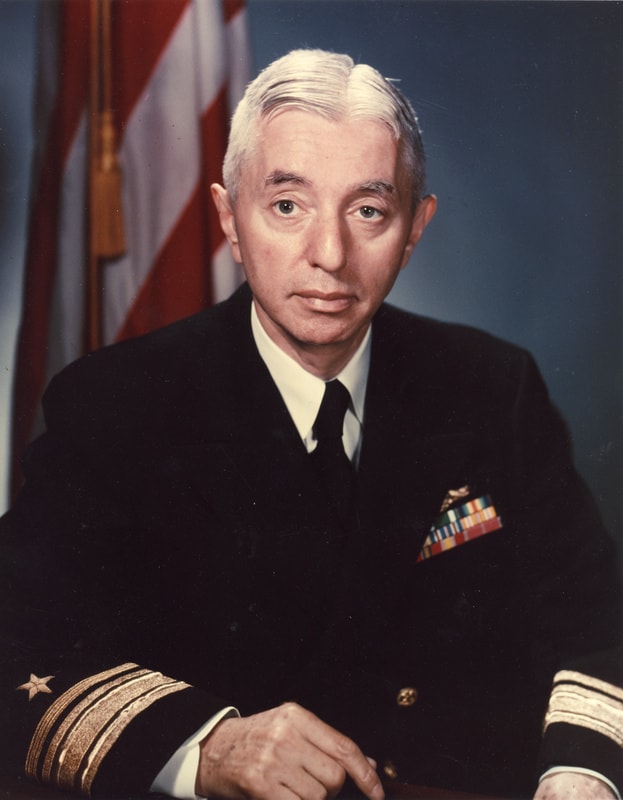
You probably can’t change your whole industry on your own. However, Admiral Rickover said…
I believe it is the duty of each of us to act as if the fate of the world
depended on him. Admittedly, one man by himself cannot do the job.
However, one man can make a difference…
We must live for the future of the human race,
and not for our own comfort or success.
What can you do? Start a performance revolution at your company/site. That’s something one person can do!
Start
Start by learning to use TapRooT® Root Cause Analysis to find and fix the causes of accidents, precursor incidents, and audit findings. We have seen people make amazing improvements by applying TapRooT® RCA. See the Success Stories HERE.
Learn more about TapRooT® RCA Training HERE and see the dates and locations of our upcoming public courses HERE.
Next
Next, you should attend the 2025 Global TapRooT® Summit on October 1-3 and pick the Best Practice Track to help you solve your company’s biggest challenges…

What you will find are participants from a wide variety of industries and disciplines from sites around the world who are sharing their best practices and who are interested in learning about yours. This is a great way to learn best practices from other industries, and about other practices that failed so, you can avoid wasting your time.
You may also choose to attend one of the 11 pre-Summit Courses on September 29-30.
Finally
And if you don’t want to take on the challenge of changing the world (or your company) all by yourself, bring a team to the Summit. You can save up to $900 OFF per attendee using the discounts outlined below.

Don’t wait. Get started improving performance NOW!