Is this trend significant?
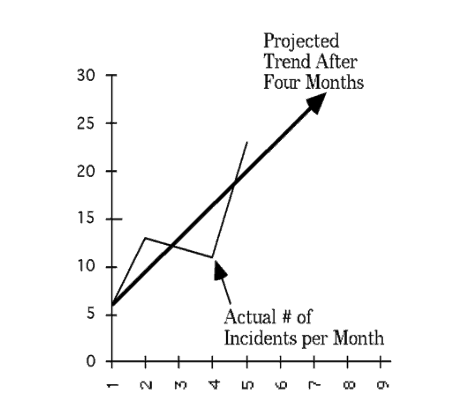
The graph above shows safety-related incidents per month. Since safety-related incidents are bad, up is bad on this graph. If we used the normal straight-line approximation to “trend” and predict performance … this is a crisis!
What should we do?
- Hire consultants.
- Fire the Safety Manager.
- Conduct a one-day safety stand-down.
- Have the CEO make a video to emphasizes that safety is the top priority.
But wait … what was last month’s top priority? Oh, don’t bother with details! This is a crisis! We need improvement and we need it fast before something really bad happens. Why? Because safety is out of control! Anybody can see from the graph. Bad things are going up at an alarming rate. We must act now and act decisively!
That’s the way trends are interpreted at thousands of companies and facilities around the world. Unfortunately, the answers we derived from the graph using a straight-line approximation are wrong.
Wrong? How can they be wrong? Look at the graph below. The four points from the first graph are the same as the first four points in the graph below. No real action was being targeted to change safety performance. The variation we are observing is just part of the random variation that happens all the time. There was NO crisis.
 What is wrong with reacting as if there is a crisis when there isn’t one? The attention to safety doesn’t hurt, does it?
Yes, it does! Every child knows the story of the boy who cried: “Wolf!” and the story of Chicken Little crying: “The sky is falling! The sky is falling!”
Look at the results in the false trend example.
- The Safety Manager lost his job. The Safety Manager didn’t think that was a positive outcome. The new Safety Manager is more likely to overreact to future trends and cause even more unnecessary emergency changes.
- Money was wasted hiring consultants and implementing fixes that probably were a waste of time. Since time, money, and effort are scarce resources, they had to be taken away from some other work. This other work (that may have been necessary) was not completed on time. Therefore, an opportunity was lost.
- Employees become jaded. Why? Because every month (or at some facilities, every day) there’s a new crisis. A new set of priorities. A new video from the CEO. Sooner or later, people lose their sense of urgency. They lose faith in management. They stop reacting to new initiatives. They know that these new initiatives will blow over (just like the last management fad). They become complacent.
You might think … This is bad.
We’ve seen worse. Much worse.
We’ve seen millions of dollars wasted on improvement programs that were scrapped just months after they were completed with NO payback on the investment.
We’ve seen hundreds of people transferred or “right-sized” during a crisis transformation program in reaction to imagined trends.
Finally, we’ve seen people stop reacting. Why? Too many crises. Management cried wolf too often. There wasn’t a way to clearly communicate the lessons that could have been learned from the real trends. A real crisis was at hand, but nobody reacted. They were overwhelmed by previous false crises. They didn’t react to the real crisis.
Want to avoid these problems from poor trending?
Learn advanced trending techniques that will help you explain what IS and IS NOT a significant trend. Get more information about the TapRooT® Trending to Manage Performance Course here:
https://www.taproot.com/summit/pre-summit-courses/
Don’t wait to register. This course is only offered once a year prior to the Global TapRooT® Summit. The next course being held in Huston (Montgomery), Texas, on March 11-12, 2019.