What is the Best Root Cause Analysis Method?

If you’ve ever searched for the best root cause analysis method, it seems like the answer depends upon who you ask. Incident investigators who use Brainstorming, 5-Whys, or Fishbone Diagram techniques may tell you whichever one they use is the best. We tend to gravitate toward what is familiar because it makes us comfortable. Why learn something new if what we are already doing is good enough?
The trouble is, we don’t know what we don’t know. Also, “good enough” root cause analysis is not the best goal. The real proof that you’re using the best root cause analysis method is in the data.
- Are you seeing reoccurrences of the same incident or problem? (Some wait to see if a corrective action works to determine whether or not the real root cause was identified. This is counterproductive!)
- Are there certain areas of the plant where incidents consistently arise?
- Does your data prove that performance is improving or are you making an assumption? (Hint: if you are not trending your data or doing audits, you probably are making an assumption.)
When we know better, we choose better. We don’t get confused about whether or not our root cause method is working the way we think it is.
So, what is the best root cause method? If you’ve read this far, then you must have some interest in knowing who the winner is. Let’s look at Brainstorming, 5-Whys, Fishbone Diagram, and TapRooT® Root Cause Analysis so you can decide.
Brainstorming Techniques

Brainstorming for root causes is exactly what it sounds like it is. It is an unstructured, informal approach to root cause analysis. You gather your investigation team for a brainstorming meeting and each team member offers an idea about possible causes of a problem, one at a time, in rotation. Or, you could conduct the meeting in an unstructured way where everyone in the room offers ideas as they come to mind. (This sounds chaotic!)
This technique feels a little bit like voting for a root cause because everyone offers an opinion, and the one with the most votes wins. Also, dominant team members will influence others who are not as outspoken about their thoughts about root causes. However, there are some good reasons to use the brainstorming technique in an incident investigation.
The next method we’ll look at incorporates the brainstorming technique and adds a little more digging into possible root causes than just throwing out ideas.
5-Whys

5-Whys is a very simple root cause analysis technique that stays with the problem a little longer by questioning the answers.
Here are the steps of a 5-Whys investigation:
- Clearly state the problem you want to investigate.
- Form a cross-functional team familiar with the problem under investigation.
- Ask the first “Why.” Encourage the team for their input.
- Document the response to the first “Why.”
- Ask “Why” again.
- Document the response to the second “Why.”
- Repeat Steps 5 and 6 for each subsequent “Why” until you’ve asked “Why” and documented the response five times.
- Brainstorm and develop countermeasures.
5-Whys Example
Problem statement: The production line in a manufacturing company is experiencing a significant increase in defects.
- Why is there a significant increase in defects on the production line? Because the operators are making mistakes during the assembly process.
- Why are operators making mistakes during the assembly process? Because they are rushed and have a tight production schedule.
- Why do the operators have a tight production schedule? Because the company has recently received a large order with a short delivery deadline.
- Why does the company have a large order with a short delivery deadline? Because they didn’t want to lose an important customer.
- Why didn’t the company negotiate a more reasonable delivery schedule with the important customer? Because the sales team did not effectively communicate with the production team about the customer’s needs and constraints, leading to unrealistic promises.
Root Cause: Inadequate communication between the sales and production team.
In theory, you are drilling down to the root cause by asking “why” five times. Sometimes you may need fewer or more than five iterations. The idea is to keep probing until you uncover the underlying issues contributing to the problem. Do you think fixing this root cause (inadequate communication) will decrease defects on the production line? It may help, but something tells me there may be more at play here.
In a 5-Whys investigation, the focus is often to find a singular root cause; however, there may be other root causes that are missed because no one thought of the right questions to ask. Further, no information collection is required for this type of investigation. So, in addition to the wrong questions being asked, the answers to the questions may not be accurate.
Three different people asking “why” five times to the same problem may come up with three different answers. Pause here for a moment and think about questions you may ask about this incident that haven’t been asked.

For example, were the operators using a procedure? Were all the operators trained? Did anything go wrong in the shift turnover? What was the work environment like? Were there any scheduling problems?
The results of this type of technique may not be consistent nor reliable as many of the conclusions drawn will depend upon the skill and knowledge of the team members. Even though 5-Whys is easy to use and apply, it is not based on facts. This allows investigators to bring their personal biases into the investigation and reach conclusions that are “best guesses.”
The next technique also uses brainstorming but has a little more structure.
Fishbone Diagram (Ishikawa Diagram)
If you like a little more visualization and structure than brainstorming and 5-Whys, a Fishbone Diagram offers that. This method is sometimes referred to as the Ishikawa Diagram because the creator’s name was Kaoru Ishikawa.
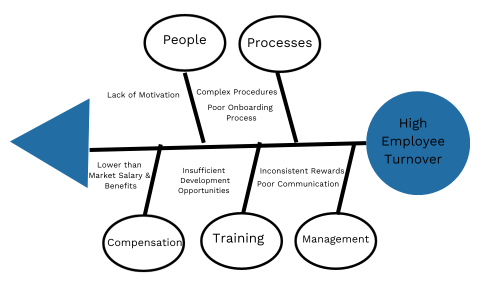
Fishbone Diagrams look a bit like a fish skeleton. Maybe the one I created below does not, but you get the idea. You write the main problem you are trying to solve on the head of the fish. The backbone of the skeleton connects the head (main problem) to the bones (possible causes). You can add predefined category labels to define sections of the bones, or you can develop your unique categories.
An example of a predefined category list is the 6 Ms of Six Sigma which describes six potential sources of problems or causes for variation in a process: Man, Machine, Materials, Method, Management, and Mother Nature (Environment). In the example below, we brainstormed our own categories based on the problem we were trying to solve.
Fishbone Diagram Example
Problem Statement: High Employee Turnover
Categories: People, Processes, Compensation, Training, Management
Possible Causes: Lack of Motivation (People); Complex Procedure, Poor Onboarding Process (Processes); Lower than Market Salary and Benefits (Compensation); Insufficient Development Opportunities (Training); Inconsistent Rewards, Poor Communication (Management)
What do you think about these possible causes? Would you add more categories for this problem? If so, what would you add?
While categories offer a bit more structure, categories may be interpreted in different ways by different investigators. There is no guidance as to which categories to add to the “bones” of the fish. The process of brainstorming and categorizing causes in a Fishbone Diagram is subjective and determined by the biases and perspectives of the team members. Fishbone Diagrams lack quantitative data. It’s a qualitative tool for brainstorming and organizing ideas, so it may not help in quantifying potential causes. There is no information collection plan to verify them.
Without guidance, investigators waste time trying to fix mistakes instead of the root causes driving those mistakes. It’s not the investigator’s job to fix the character of workers either, and that’s the trap they fall into using Fishbone, 5-Whys, and Brainstorming. In this example, the countermeasure for “lack of motivation” may be discipline or worse, termination. Blaming the workers or telling them to “be more motivated or get fired” is an ineffective solution. It’s better to focus on the work systems so workers are more successful and less likely to make errors.
The next root cause technique we will look at is not a technique. It is a root cause system and software.
TapRooT® Root Cause Analysis

The TapRooT® Root Cause Analysis is a system, a guided method to help investigators go beyond their knowledge. This provides consistency and thoroughness in the root cause analysis.
TapRooT® Root Cause Analysis Example
Let’s take the 5-Whys example, “The production line in a manufacturing company is experiencing a significant increase in defects,” and learn how we would approach it in a TapRooT® Investigation.
There are two investigation processes in the TapRooT® System, one for low-to-medium risk incidents and one for major incidents. Let’s classify this problem as low-to-medium risk. (The process for major investigations is the same, with more advanced tools available for evidence collection).
- Create a SnapCharT®. A SnapCharT® is an information collection planning tool, a central repository for information collected, and a timeline that leads to the incident.
- We know the production line is experiencing a significant increase in defects, so we would record the worst thing that happened because of that on the SnapCharT® timeline. Let’s say we decided that the worst thing that happened was delivering the product to the customer late.
- Now, instead of focusing on the production line and going after a single root cause, we are going to collect all the information we can find about how we delivered the product late. We always ask “what happened” before we think about why it happened. Information collection is a HUGE part of the TapRooT® System (about 70% of the investigation is dedicated to it). This minimizes investigator bias and bases the investigation on facts, not opinions.
- Production line defects, rushed workers, time constraints, and communication issues will all be included on the SnapCharT® as they were in the 5-Whys example, but so will the answers to the additional questions we asked: Were the operators using a procedure? Were all the operators trained? Did anything go wrong in the shift turnover? What was the work environment like? Were there any scheduling problems? (You may be wondering how I developed these questions. I developed them by using the guidance of the TapRooT® System – not off the top of my head. I don’t have to be the expert, I just need to follow the system which was built by the experts.)
- Determine if there is any more to learn. Once a SnapCharT® is complete, you decide whether or not to keep spending resources on the investigation. From what we see here, there are definitely things we can learn.
- Identify Causal Factors. This is another thing that sets a TapRooT® Investigation apart from the three techniques above. When the SnapCharT® is complete, we identify the mistakes, errors, and equipment failures in the timeline we built that directly led to the incident (delivering the product to the customer late) or failed to mitigate the consequences.
- Take each Causal Factor through the TapRooT® Root Cause Tree to find root causes. We don’t fix Causal Factors, we fix the root causes of Causal Factors. Let’s say in addition to communication issues, we found that procedures were not used; work turnover needed improvement because one shift was not setting up the workspace for the next shift to be successful before clocking out; and housekeeping issues were making it difficult for the operators to do their work on time. TapRooT® Root Cause Analysis does not focus on a single root cause, or the “rootiest root cause.” Instead, it focuses on finding and fixing *all* the root causes.
- Develop outside-of-the-box Corrective Actions with the TapRooT® Corrective Action Helper Guide. We can improve communication between departments but now we can improve our production processes too. Maybe after we fix *all* of the root causes, we can handle big orders after all, and gain the trust of many more big, important clients. One of the most valuable lessons I’ve learned in working with the TapRooT® Team for almost two decades is that a good root cause analysis is more than discovering what’s causing the problem or who is making mistakes. It is improving the work system and thus, improving human performance.
All the work above is completed with expert tools that guide me from start to finish: SnapCharT®, Causal Factor Worksheet, TapRooT® Root Cause Tree and TapRooT® Root Cause Tree Dictionary®, and TapRooT® Corrective Action Helper Guide®.
The TapRooT® System is a robust system that anticipates the problems investigators experience with the Brainstorming, 5-Whys, and Fishbone techniques: investigator bias, categorization issues, no (or insufficient) information collection, little expert guidance (did I mention TapRooT® has human factors expertise built-in?), lack of data trending (TapRooT® Software does it for you), and more.

So, Who is the Winner?
You know which one I think is the best but I’m interested in your experiences too so please leave your comments below. I would challenge you to try TapRooT® Root Cause Analysis and let your trending data decide.
If you want to learn more about TapRooT® Root Cause Analysis, schedule an Executive Briefing. We will give you a whole hour for free, tell you more about the TapRooT® System, and open the floor to you and your team to ask anything you ever wanted to know about what we think makes TapRooT® Root Cause Analysis the best.
Find out more about our root cause analysis training HERE and the schedule for upcoming public courses HERE. And CLICK HERE to find out more about our patented, easy-to-use,industry-leading software.