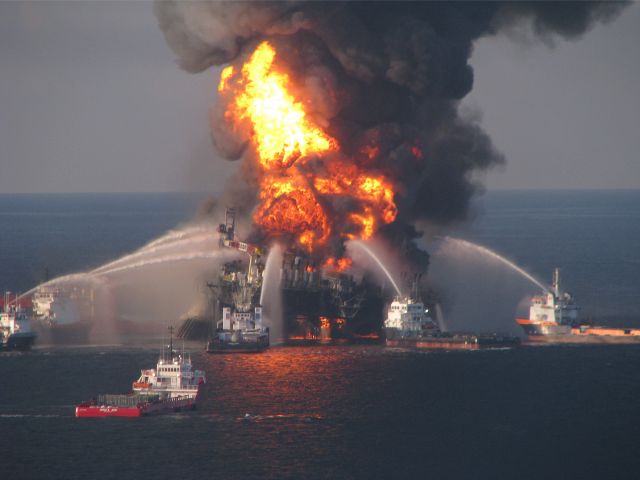
Great Letter to the Editor in the Wall Street Journal Lays Out Causal Factors Immediately Before the Deepwater Horizon Well Blowout

In a Letter to the Editor in the Wall Street Journal, Terry Barr, President of Samson Oil & Gas, laid out a great summary of the causal factors right before the well blowout that killed 11 people on the Deepwater Horizon.
Here’s a brief summary (taken from his letter) of those causal factors:
a) “The cementing crew, which was being supervised by BP, had difficulty landing the top plug into the casing shoe.” (Causal factor for cementing job failing …. may be caused by previous well construction problems)
b) The Second negative pressure test failed, but operations went ahead to remove the mud. (Causal Factor) “In this case, evidence has been bought before the committee that there was a 1,400 psi pressure response. This response is highly diagnostic and is, therefore, the second “red flag,” and at this point, the BP supervisors should have concluded that they had what the industry calls a “wet shoe.” That is that the cement job had failed to form a seal at the casing around the reservoir, which we know contains high-pressure oil and gas.” … “At this point, a decision should have been made to do a remedial cement job; this is an expensive operation, but having seen a 1,400 psi response, there was no choice.”
c) Second cement plug not used. (Causal Factor) “Given the two red flags that had been thrown up previously, one would have expected that as a precaution, a cement plug would have been placed somewhere in the wellbore as a secondary pressure seal before this primary pressure control system (heavy mud) was evacuated from the wellbore. But at the very least, the mud replacement operation should have been heavily scrutinized. Clearly, it was not.”
d) Evidence of a pending blowout not responded to/missed/ignored. (Causal Factor) “Evidence provided at the hearing, including the pressure data transmitted from the rig for the last two hours before the explosion, is diagnostic. At 8:20 p.m. on the day of the explosion, the pressure data suggest there was a constant flow of seawater being pumped into the drill pipe that was displacing the heavier mud system, which was the primary pressure control for the well. The rate going in was 900 gallons per minute, but the flow data of mud coming out was steadily increasing from 900 gallons a minute at 8:20 p.m. to a rate of 1,200 gallons per minute at 8:34 p.m. During this 14-minute period, one can conclude that hydrocarbons were flowing and pushing more fluid from the wellbore than was being pumped in.”
“This is what this data is supposed to monitor, but the well flow evidence would appear to have been ignored because, at this point, the BP rig supervisors should have gone to a well kill operation and started to pump heavy mud back into the well bore to restore the primary control mechanism. Instead, the mud continued to be evacuated.”
e) Again, evidence of a pending blowout not responded to/missed/ignored. (Causal Factor) “At 9:08, there was another piece of evidence that is very clear cut. The seawater pump was shut down, presumably to check the well stability. However, with the pump shut down, a pressure increase was seen in the standpipe (SPP). This pressure response has to be associated with the reservoir flowing hydrocarbons, and again at this point, kill operations should have been initiated by the BP engineers.
f) Again, evidence of a pending blowout not responded to/missed/ignored. (Causal Factor) “From 9:08 p.m. to around 9:30, despite the seawater pump either running at a constant volume or shut-in, the SPP continued to increase; again, this is evidence that the well is producing hydrocarbons and should have caused a kill operation to be initiated.”
g) Again, evidence of a pending blowout not responded to/missed/ignored. (Causal Factor) At 9:30 p.m., the seawater pump was again shut-in to presumably observe what the well was doing, and again there is a notable increase in the standpipe pressure.
I haven’t seen as clear an analysis of the work leading up to that night (the well construction process), but I would bet there are multiple causal factors that contributed to the failure of the well.
In addition, there are also causal factors that contributed to the failure of the BOP.
All these causal factors need to be analyzed using the Root Cause Tree® Diagram to find the real root causes, including Management System root causes, of the accident.
Thanks to Terry for the great analysis!


