Comparing Major Root Cause Analysis Techniques

What is Root Cause Analysis?
Let’s start with a dictionary definition of root cause from the Collins Dictionary:
“The fundamental reason for the occurrence of a problem.”
I think this type of definition leads many astray. Why? There isn’t an agreement on what is “fundamental.” For example, some may think that a “human error” is a fundamental reason for an occurrence. We’ve discussed this misunderstanding before HERE.
Here is another definition of “root cause” from the American Society for Quality:
The root cause is the core issue—the highest-level cause—that
sets in motion the entire cause-and-effect reaction that ultimately leads to the problem(s).
This definition doesn’t solve the problem of the previous definition. It just changes “fundamental” to “highest-level.” It also adds the idea that the root cause “sets in motion the entire cause-and-effect chain.” I’ve never liked the idea of an initial problem being the “root” – so this definition also leads investigators astray.
Even the definition that David Busch and Mark Paradies created in 1985 and published in 1986 had a similar problem:
ROOT CAUSE DEFINITION
The most basic cause (or causes)
that can reasonably be identified
that management has control to fix.
After all, how much different is “most basic” than the Collins Dictionary’s word “fundamental?” (See more about our early definitions HERE.)
However, by 2006, System Improvements created a new definition for a Root Cause:
ROOT CAUSE
A Root Cause is the absence of a best practice
or the failure to apply knowledge that would have prevented the problem.
Thus, most root cause analysis techniques that we will evaluate don’t lead investigators to identify the best practice they are missing or the knowledge they haven’t applied that allowed the problem to occur. Instead, they try the same old answers that haven’t worked before and expect a different result. (That’s the definition of insanity?) And as Albert Einstein said:
“It’s impossible to solve significant problems
using the same level of knowledge that created them.”

We will use the last definition to define Root Cause Analysis as:
ROOT CAUSE ANALYSIS
“The process of finding the missing best practices
or knowledge needed to prevent a problem.”
The definition above seems simple, but, as Admiral Rickover said, “The devil is in the details.” And that’s why we will use it to compare the major root cause analysis techniques to see which does the best job of meeting the definition of root cause analysis.
Why Compare Root Cause Analysis Techniques?
All root cause analysis techniques have advantages and disadvantages. However, I’m frequently asked about various techniques, and therefore, I thought I’d write a brief comparison of the major root cause analysis techniques to help people consider which technique to implement.
For each technique, I’ll briefly explain the technique and the advantages and disadvantages as I see them after 40 years of research, evaluation, and development. I’ll also provide references when available.
The eight major techniques I’ll review include:
- 5-Whys
- Fishbone Diagram
- Failure Modes and Effects Analysis (FMEA or FMECA)
- Cause-and-Effect
- Fault Tree
- Brainstorming
- 8D
- TapRooT® Root Cause Analysis System
We will not review the three techniques below that are often referred to as root cause analysis, but are mainly evidence collection techniques or data evaluation techniques:
- Pareto Chart
- Satter Diagrams
- Change Analysis
Change Analysis is among the optional evidence-collection techniques in the TapRooT® RCA System, which is evaluated below.

Pareto Charts are included in the trending book (book 8) in the ten-book TapRooT® Series.
5-Whys

5-Whys is one of the simplest root cause analysis techniques. The simple description is for the investigator to ask “why” five times. But 5-Why experts explain that asking why 5 times isn’t always enough.
5-Whys is also easy to understand. Sometimes people use it with no, or little training (which can be a problem).
The 5-Whys technique is used in many Six Sigma programs and for the analysis of healthcare sentinel events. For some 5-Why examples, see THIS LINK.
Advantages of 5-Whys
The main advantage of using the 5-Why technique is its ease of use.
People also point out that it is better than no technique at all.
People also say that it can help beginners think more deeply about the cause of an incident.
Disadvantages of 5-Whys
The first disadvantage is that 5-Whys does not provide any guidance for the right questions to ask. Thus, asking five whys doesn’t help people go beyond their current knowledge. This can be especially true for people who have little to no 5-Why training.
Second, in most applications of the 5-Whys technique, the investigator asks only 5 whys for a single problem. Thus, for problems with multiple causes, only a single cause is investigated.
Third, the investigator often starts the investigation with a presumption about the root cause. Then they make the five-why chain arrive at the answer they presumed. The scientific term for this phenomenon is “confirmation bias.” Read more about it HERE.
Fourth, asking why five times doesn’t help the investigator determine what happened, which really should be explored before one starts trying to figure out why the incident/problem happened. You must understand “What Happened” BEFORE you start trying to find out “Why It Happened.” Without understanding what happened, people using the 5-Whys often jump to conclusions without completing their fact-finding, which can exacerbate confirmation bias.
Finally, because 5-Whys offers no guidance for analyzing human error, investigators often stop their 5-Whys there. They find that “Human Error” was the cause of the incident. This can lead to blame. In fact, one manager told me that they often joked that the technique should be called:
5-Whys and Who Do We Fire?
For another, more detailed critique of the 5-Whys, see this article from Quality Progress:
Fishbone Diagram
The root cause analysis technique known as a Fishbone Diagram (or Ishikawa Diagram) was developed by university professor Kaoru Ishikawa in the 1960s as a quality control tool. He published a description of the technique in 1990 in the book Introduction to Quality Control.

A Fishbone Diagram (a sample of which is shown below) shows the problem at the head of the fish-like diagram. The bones of the fish organize major factors that can bring success or failure to the process, and are attached to the spine. In the example below, the major factors are:
- Site
- Task
- People
- Equipment
- Control

Each of the major factors attached to the spine has additional bones in that category that outline the cause-and-effect relationships that may be causing the problem.
You can use various techniques to develop a cause-and-effect relationship, but people often describe using a 5-Why type questioning process to create the cause-and-effect framework.
Another method that people use to develop the bone-like structure is brainstorming. The team brainstorms the major factors influencing performance (the main bones attached to the backbone). Then, they brainstorm potential root causes of the problem for each major performance factor. The team then reviews their potential causes and identifies the “most likely” root cause (or, in some cases, root causes).
The diagram above comes from this article (LINK), which also includes the video below that outlines the use of a Fishbone Diagram.
Another article used the example below to describe a Fishbone Diagram…

A Fishbone Diagram is often used as a problem-solving tool in Lean implementations.
For another description of how to develop a Fishbone Diagram, see THIS LINK.
Advantages of Fishbone Diagrams
First, the Fishbone Diagram is fairly easy to use. Like 5-Whys and Brainstorming (which can be used to develop the “bones”), the technique is fairly simple to learn and apply.
Next, the technique is visual. It is easy to see what the investigator sees as the main problem (the head of the fish), the major factors influencing performance (the main bones attached to the spine), and the potential causes (the minor bones). The Fishbone Diagram provides a clear and easy-to-understand representation of the cause-and-effect relationship that the investigator wants to communicate.
Also, Fishbone Diagrams have a long history (over 50 years) of use. It certainly was one of the original techniques developed to help problem solvers understand the causes of a problem.
Finally, many claim that it is an effective tool for root cause analysis.
Disadvantages of Fishbone Diagrams
The disadvantages of the Fishbone Diagram technique are similar to the disadvantages of 5-Whys (outlined above).
First, the technique is based on the root cause analysis technique of Cause and Effect. Cause and Effect has several drawbacks that we will outline in the disadvantages of Cause-and-Effect below.
Second, in all the examples I’ve seen, there is no guidance for building the bones of the fish. The building of the bone structure depends on the knowledge of the investigator or investigative team. And many (or should I say most?) investigators don’t have training in the causes of human errors (the science of human factors). Thus, the bones on their Fishbone Diagram are their guesses at the causes of human errors, and they don’t have any human factors to guide them beyond their knowledge of human error.
Third, Fishbone Diagrams don’t provide guidance on what constitutes a “root cause.” Thus, there isn’t a clear understanding of where the “bones” should end. Many think they know the definition of a root cause, but don’t have a standard definition for their team.
I’ve heard people use “voting” by the team as a way to determine the “root cause” of the many bones on the Fishbone Diagram. Brainstorming, followed by voting, is simply a means of gathering the team’s opinions. It doesn’t prove that the cause selected really was the incident’s cause.
Fourth, the other technique that can be used to develop the bones of a Fishbone Diagram – Brainstorming – has drawbacks outlined below.
Fifth, Fishbone Diagrams don’t help the investigator determine what happened, which should be explored before trying to figure out why the incident/problem occurred. You must understand “What Happened” BEFORE you start trying to find out “Why It Happened.” Without understanding what happened, people using Fishbone Diagrams often jump to conclusions without completing their fact-finding. Thus, they don’t have proof of why the bones on their Fishbone Diagram are root causes.
Sixth, Fishbone Diagrams provide no guidance to investigators in developing effective corrective actions. Therefore, the team often ends up picking one or more of the three standard corrective actions:
- Training
- Procedures
- Discipline
And these three standard answers certainly aren’t the whole list (or an effective list) of corrective actions.
Failure Modes and Effects Analysis
This technique is also known as FMEA, or Failure Modes, Effects, and Criticality Analysis. The technique is often used by engineers proactively to analyze potential failure modes in equipment or processes. FMEA is an inductive, bottom-up analysis process.
The process commonly has five steps:
- Identify failure modes.
- Analyze the effect (impact) of each failure mode.
- When performing a criticality analysis, prioritize failure modes by severity and likelihood.
- Develop fixes prioritized by the criticality analysis.
- Implement the fixes to mitigate potential failure modes.
The same process can be applied to incident-related processes.
For additional information about FMEA, see THIS LINK.
Advantages of Failure Modes and Effects Analysis
First, many engineers are familiar with FMEA, so minimal training may be required for engineers.
Second, the technique has been proven to help find potential problems with equipment and processes.
Disadvantages of Failure Modes and Effects Analysis
First, the technique is mainly focused on equipment failures and doesn’t work as well for human performance issues.
Second, the technique is not immediately apparent to those without technical training. Therefore, either extensive training would be required, or technical personnel would be needed for each investigation.
Third, the first step, identifying the failure modes, depends on the imagination of the engineer leading the process. Often, after an accident involving equipment or a process that previously been analyzed using FMEA, the failure mode discovered subsequently was previously deemed “not credible” or was not even considered.
Fourth, when FMEA is applied reactively, it depends on the engineer’s ability to identify the failure modes and effective corrective actions without guidance. Once again, this doesn’t help the investigator (or team) go beyond their current knowledge.
Cause-and-Effect
Using Cause-and-Effect (or a Cause-and-Effect Diagram) is explained in this nine-minute video…
Note that this video shows the Cause-and Effect-Diagram as a Fishbone Diagram. However, the cause-and-effect relationship can also be illustrated using a 5-Why Diagram, a Why-Why Diagram, or another visual representation of the cause-and-effect relationships.
For another very positive description of Cause-and-Effect Analysis, see THIS LINK.
Advantages/Disadvantages of Cause-and-Effect
The advantages and disadvantages are the same as those for 5-Whys and Fishbone Diagrams.
Fault Tree
Fault Tree Analysis is a deductive, top-down method that uses Boolean Algebra to find the potential causes of a system failure. It is usually used proactively and applied by engineers. The top of a Fault Tree Diagram is the potential failure to analyze. Below that are AND or OR gates that determine paths needed to cause the potential failure. Below is a Fault Tree from an example presented in SMARTDRAW Software.

For additional information about Fault Trees, see THIS LINK.
Advantages of Fault Trees
Many engineers are trained to develop Fault Trees, so no training is required for previuously trained engineers.
Fault Trees are easiest to apply to equipment failures.
The graphical nature of a Fault Tree is easy to understand for those with a technical orientation.
Disadvantages of Fault Trees
The biggest disadvantage is that the undesirable events must be imagined without any guidance from the technique. This is especially true for human error-related causes of events.
For those not technically oriented, the technique can be difficult to learn and apply.
The technique can be time-consuming.
Usually, the technique requires engineers to lead the analysis.
Brainstorming
Brainstorming is a group process. Everyone in the group gives an idea in rotation (or passes his/her opportunity to give an idea) until the next round. It’s kind of like the child’s card game, “Go Fish.” Even a kindergartener can do it!
The question really is … Is this root cause analysis or just guess-a-cause? Perhaps Spin-A-Cause™ would be better?

Advantages of Brainstorming
Brainstorming seems like an easy process.
When taking turns providing ideas, multiple viewpoints can be considered.
Disadvantages of Brainstorming
Brainstorming is not really root cause analysis.
Brainstorming is not systematic.
Different teams get different results.
One person can dominate a Brainstorming session.
Brainstorming does not prevent confirmation bias.
Brainstorming does not help a group go beyond its current knowledge.
8D
8D is more of a problem-solving process than a root cause analysis tool.
8D can use any of the root cause analysis tools discussed here.
Here are the steps in a typical 8D process:
- D0 – Plan for the 8D process.
- D1 – Form a team.
- D2 – Define the problem.
- D3 – Develop an interim containment plan.
- D4 – Root cause analysis (use any technique).
- D5 – Develop corrective actions.
- D6 – Implement and validate corrective actions
- D7 – Develop and implement corrective actions for generic problems.
- D8 – Provide feedback to the team and celebrate
Advantages and Disadvantages of 8Ds
The advantages and disadvantages of this process depend on the root cause analysis tool that is used. Therefore, refer to the particular root cause analysis tool that is used in an 8D implementation for that technique’s advantages and disadvantages.
TapRooT® Root Cause Analysis System
The TapRooT® System is a systematic incident investigation and root cause analysis system based on a proprietary set of tools for information collection, root cause analysis, and corrective action. The system has a simple 5-step process for simple investigations and a more robust 7-step process for major investigations. The 5-step process uses the two required techniques, while the 7-step process includes four optional techniques in addition to the required techniques.
The required techniques are:
- The SnapCharT® Diagram
- The Root Cause Tree® Diagram
The optional techniques are:
- Change Analysis
- Barrier Analysis
- Equifactor® Equipment Troubleshooting
- Critical Human Action Profine (CHAP)
Other parts of the TapRooT® System include the Root Cause Tree® Dictionary and the Corrective Action Helper® Guide. All the techniques, the dictionary, and the guide are built into the award-winning, patented TapRooT® Software.
For simple incidents, there is a simple five-step process (shown below) that only requires the required techniques.
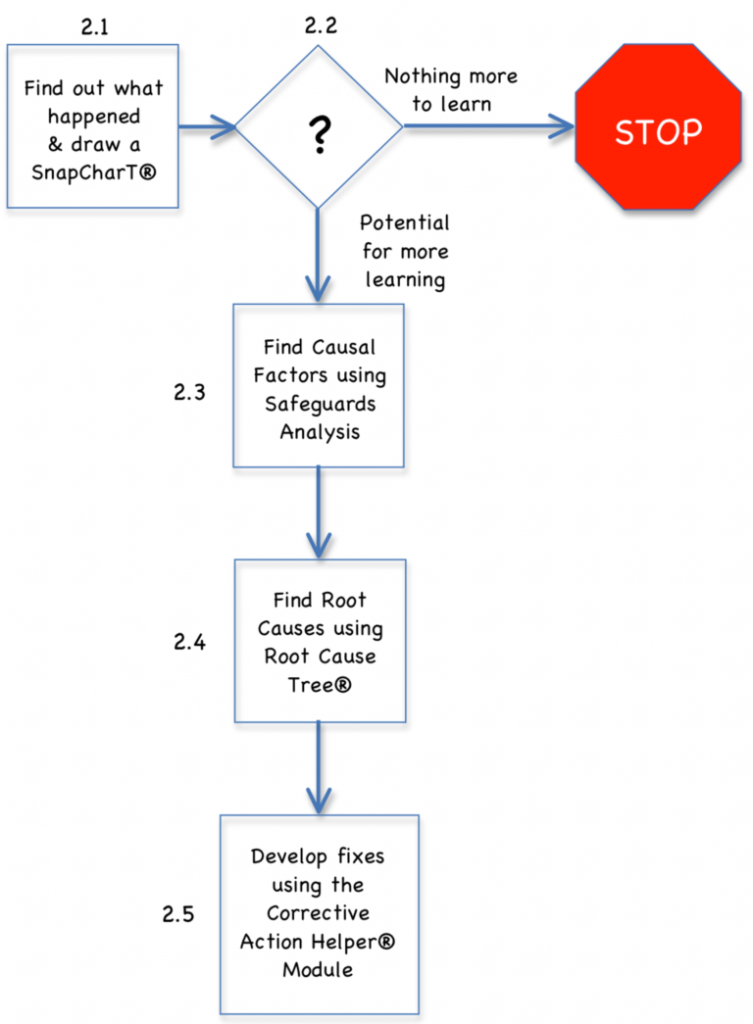
For more complex incidents, there is a seven-step process (shown below).

To see an example of an environmental incident investigated using the TapRooT® System, CLICK HERE.
The TapRooT® System is well documented in a ten-book reference set.
")
System Improvements provides a variety of guaranteed training courses, including a:
- 5-Day TapRooT® Advanced Root Cause Analysis Team Leader Course
- 2-Day TapRooT® Root Cause Analysis Course
- 2-Day Equifactor® Equipment Troubleshooting and TapRooT® Root Cause Analysis Course
- 3-Day Virtual TapRooT® Root Cause Analysis Course
To see the upcoming public courses, CLICK HERE.
Advantages of the TapRooT® System
The TapRooT® System is a complete investigation system that includes all the root cause analysis tools needed.
TapRooT® RCA is a guided root cause analysis system that can help your investigators go beyond their current knowledge. This is especially helpful when investigating incidents involving human error.
TapRooT® Root Cause Analysis starts with planning, interviewing techniques, and information collection. This helps your investigators avoid jumping to conclusions, helps avoid confirmation bias, and makes your root cause analysis “fact-based.”
The advanced interviewing techniques are based on cognitive interviewing research. This helps investigators collect more information to base their findings upon.
The interviewing techniques and the use of the SnapCharT® Diagram are not blame-oriented. This promotes voluntary participation from those involved in an incident.
The Equifactor® Equipment Troubleshooting Tool helps investigators better understand the causes of equipment failures to aid in finding the failure’s root causes.
The Root Cause Tree® Diagram is a proven method for identifying root causes of equipment and human performance problems. It guides investigators by providing a Human Performance Troubleshooting Guide, a Dictionary of questions to better define root causes, and seven Basic Cause Categories, each packed with potential root causes related to best practices to improve human performance.
The TapRooT® System goes beyond root causes to find Generic Causes (system causes that, when corrected, can eliminate whole classes of root causes).
The TapRooT System supports the development of corrective actions. This includes training on the use of the Safeguard hierarchy to develop stronger, SMARTER corrective actions.
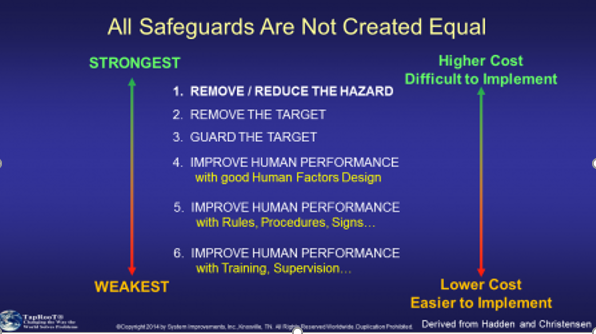
Plus, the Corrective Action Helper® Guide to develop “outside the box” more effective corrective actions.

In addition to the required and optional techniques mentioned above, the TapRooT® Software includes investigation and root cause analysis grading and coaching tools to help investigators improve their investigative skills.
The software also includes easy-to-use management presentation tools.
The TapRooT® Root Cause Analysis System was developed and tested by experts and has been proven effective by leading companies from around the world. Click HERE for a wide variety of user-provided Success Stories.
TapRooT® System is continually improved with feedback from thousands of users worldwide. This feedback includes course attendee ideas (over 10,000 people are trained to use TapRooT® RCA each year), field experience, and ideas from the TapRooT® Advisory Board (over 60 TapRooT® Users from industry-leading companies worldwide).
These improvement ideas led to the development of:
- The TapRooT® Software (now hosted in the cloud)
- Course improvements
- The Corrective Action Helper® Guide/Module
- The Equifactor® Equipment Troubleshooting Tables (collaborating with Heinz Bloch)
- New root causes in the Root Cause Tree® Diagram
- Improved definitions in the Root Cause Tree® Dictionary
- The 5-step process for simple investigations
- The latest TapRooT® Books
System Improvements provides worldwide support with instructors and facilitators throughout:
- North and South America
- Europe
- Africa
- The Middle East
- Oceana and Asia
The TapRooT® System was designed to facilitate root cause trending.
The TapRooT® System can be applied reactively (to investigate precursor incidents or accidents) or proactively (in audits, assessments, Gemba Walks, or other observation and review activities).
Disadvantages of the TapRooT® System
TapRooT® RCA is a proprietary system and software. To effectively use the TapRooT® System requires training. However, the TapRooT® Training comes with a guarantee:
Attend a course, go back to work, and use what you have learned to analyze accidents, incidents, near-misses, equipment failures, operating issues, or quality problems. If you don’t find root causes that you previously would have overlooked, and if you and your management don’t agree that the corrective actions that you recommend are much more effective, just return your course materials and we will refund the entire course fee.
Using the software (not required but recommended) requires a software license based on the company’s size (total number of employees).
TapRooT® RCA may require more time and effort than other incomplete analyses of lesser techniques.
Results of the Comparison
I think the answer to which root cause analysis technique is superior is obvious.
1. Which root cause analysis technique is easiest to use? 5-Whys appears to be the easiest. But remember Einstein’s quote:

Perhaps being the easiest is not a blessing?
2. Which technique provides both guidance to root causes and corrective actions based on best practices and knowledge? (Similar to the root cause definition.) The TapRooT® Root Cause Analysis System.
3. Which technique is suitable for simple incidents and major accidents that include human performance and equipment failure aspects? The TapRooT® Root Cause Analysis System.
4. Which techniques are a complete investigation system? 8D and the TapRooT® Root Cause Analysis System.
5. Which technique guides investigators beyond their current knowledge? That’s easy – the TapRooT® Root Cause Analysis System.
6. Which technique has the best documentation? Arguably, the TapRooT® Root Cause Analysis System has the best documentation.

7. Which technique has guaranteed training? As far as we know, only TapRooT® Root Cause Analysis has guaranteed training.
8. Which technique is designed to prevent blame and promote cooperation of those involved in the incident? The TapRooT® Root Cause Analysis System.
9. Which technique includes a tool for equipment troubleshooting? The TapRooT® System.
10. Which technique has award-winning, patented software? Only the TapRooT® Root Cause Analysis System.
That’s a very impressive list of wins for the TapRooT® Root Cause Analysis System. Eight out of ten wins and one tie. The only disadvantages of the TapRooT System are that it is not as easy as asking why five times, and TapRooT® RCA requires you to receive guaranteed training and pay for award-winning, patented software to achieve superior root cause analysis results.
However, I’ll let you evaluate the techniques and decide which tool to use for mission-critical incident analysis.
If you have comments or questions, please leave them in the comment form below.


Very comprehensive and useful