PSM and the 100 Largest Losses in the Hydrocarbon Industry
Are Losses Increasing?
The short answer is no – PSM major losses are not increasing over time. But they don’t seem to be decreasing either.
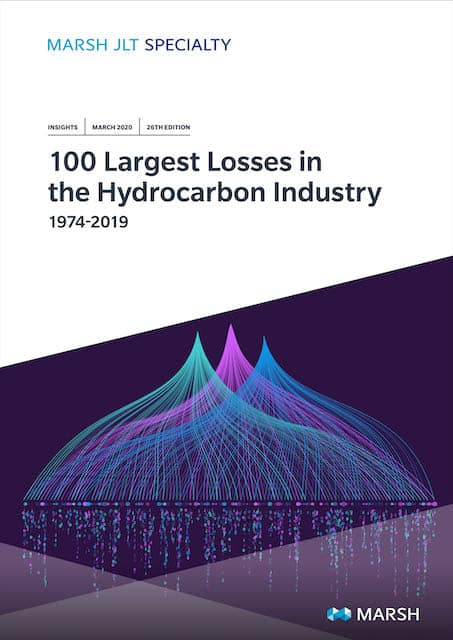
The graph and list below show data from the 2020 Marsh JLT Specialty report 100 Largest Losses in the Hydrocarbon Industry, 1974-2019.
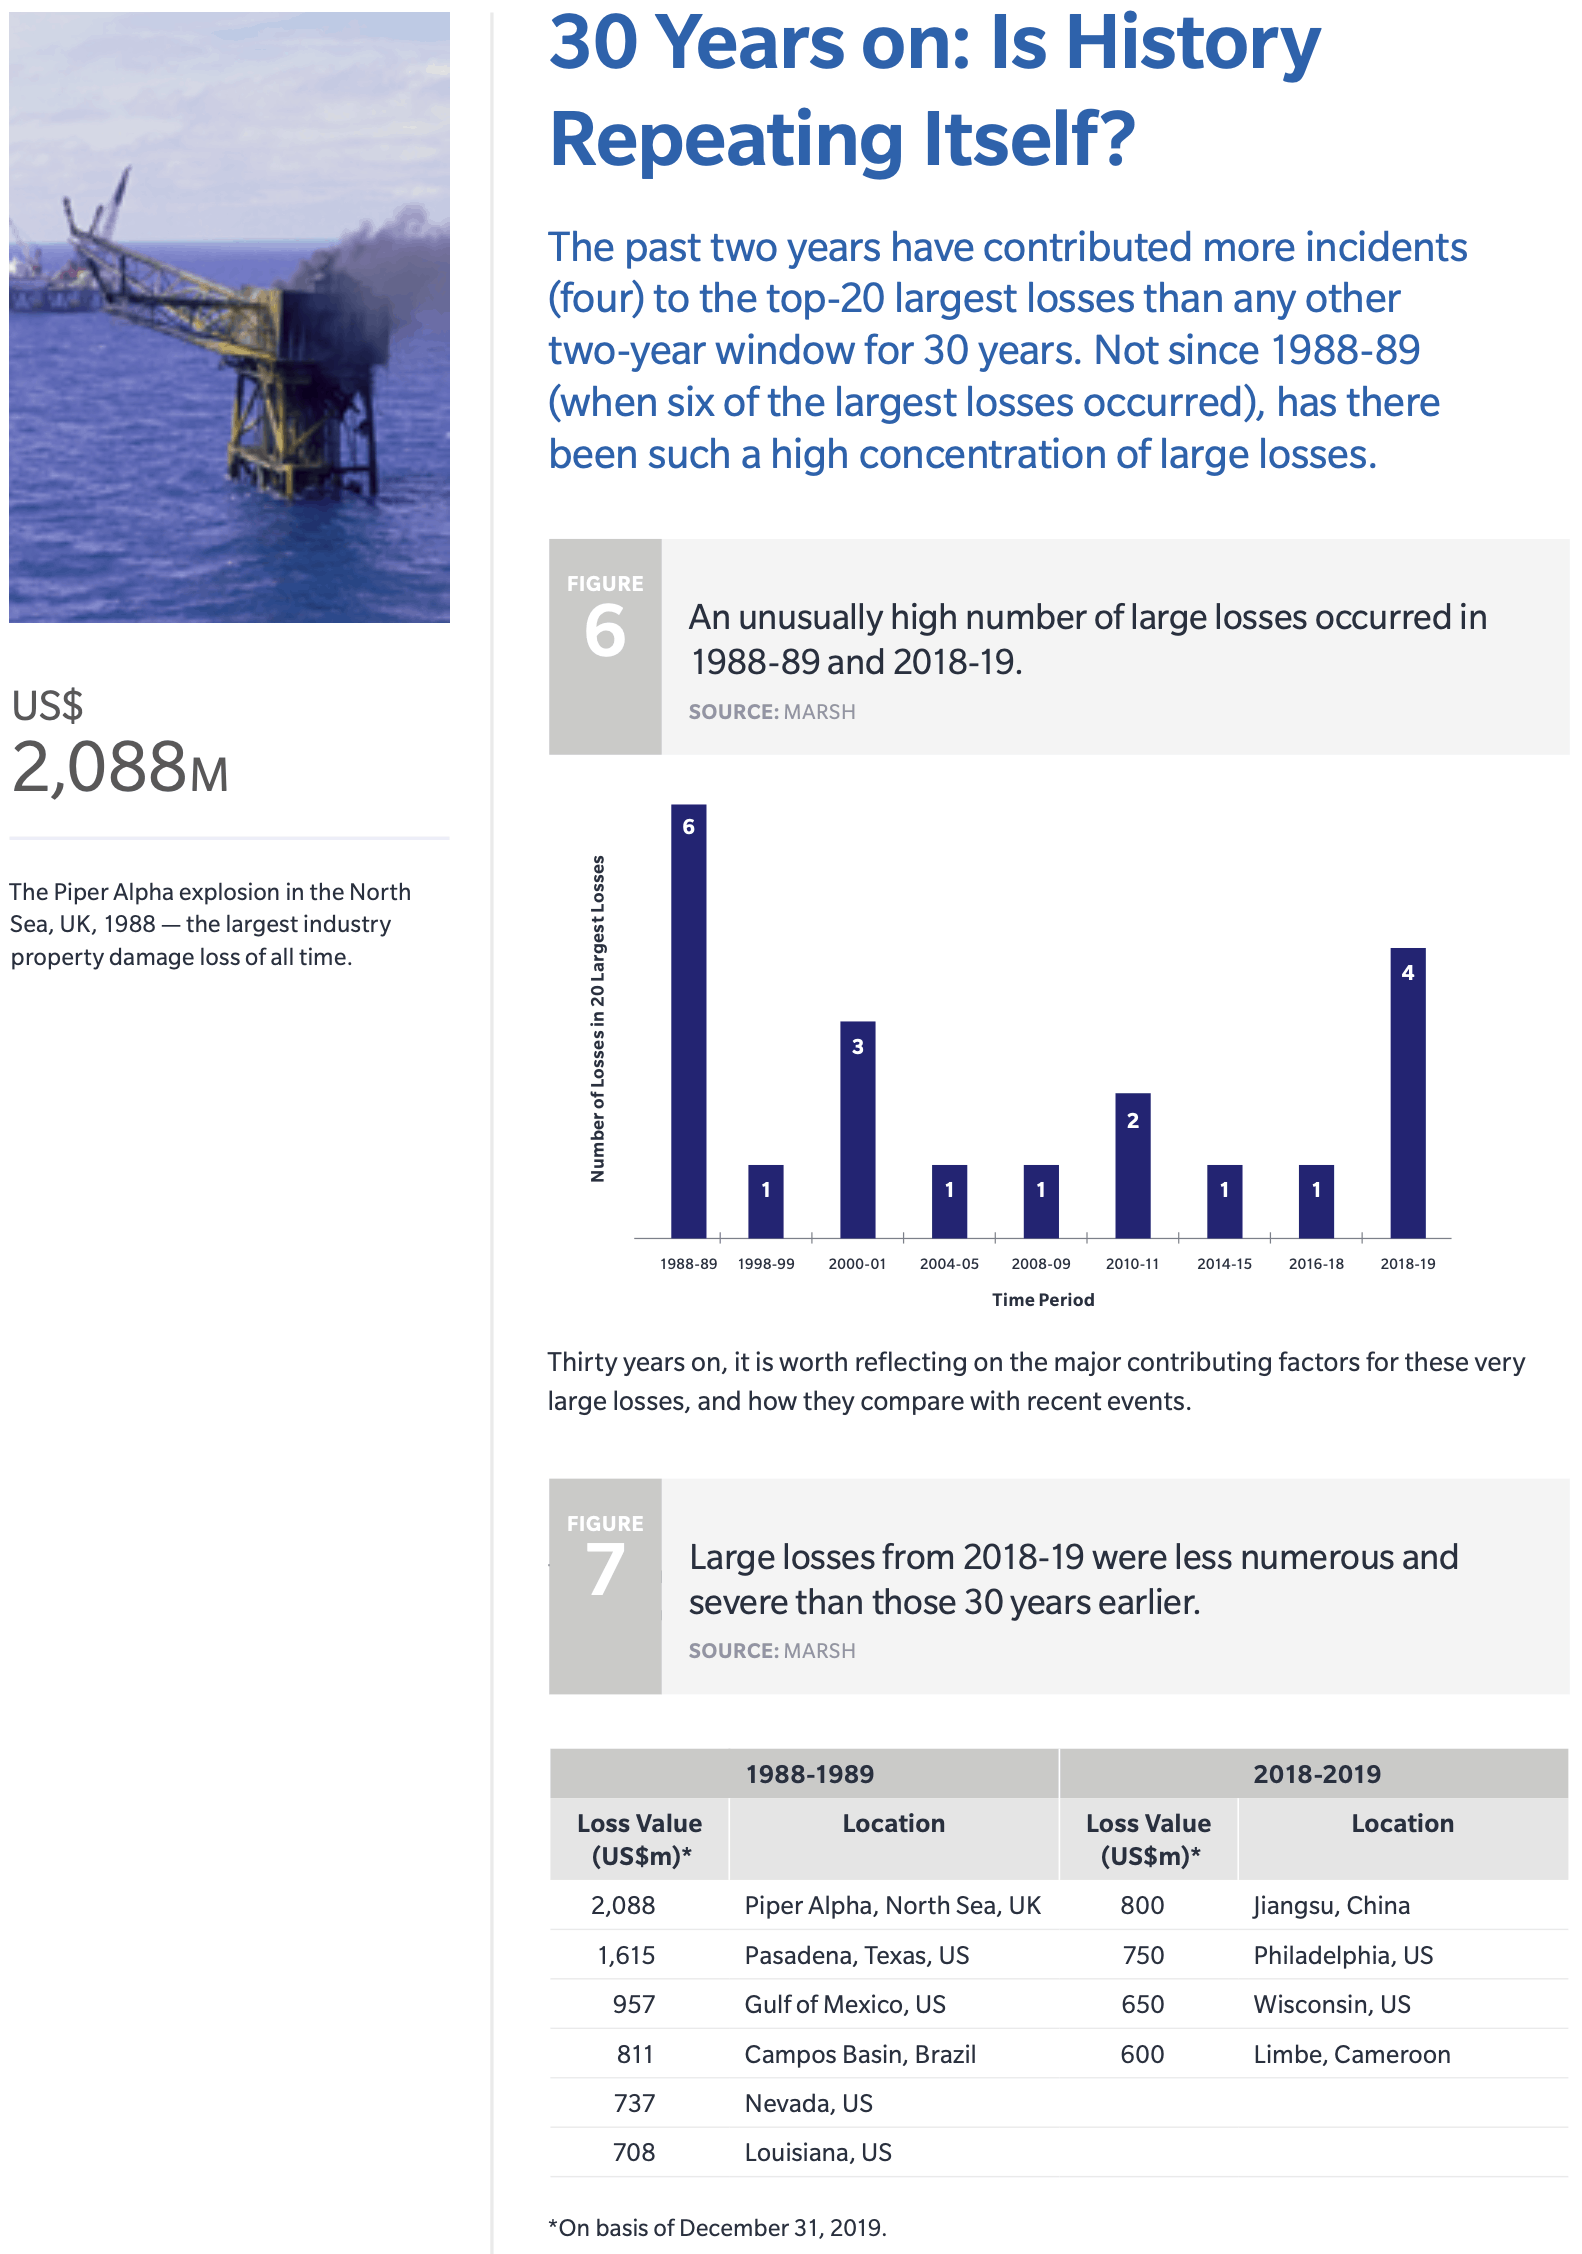
The most expensive loss in 2018-2019 was in Jiangsu, China. 78 people were killed and 640 people were hospitalized. Here is a link to a story about the accident…
https://news.cgtn.com/news/3d3d514f304d444f33457a6333566d54/index.html
Is This a TREND?
First, despite the inference from the article, I don’t this this data represents a trend. See the graph below…
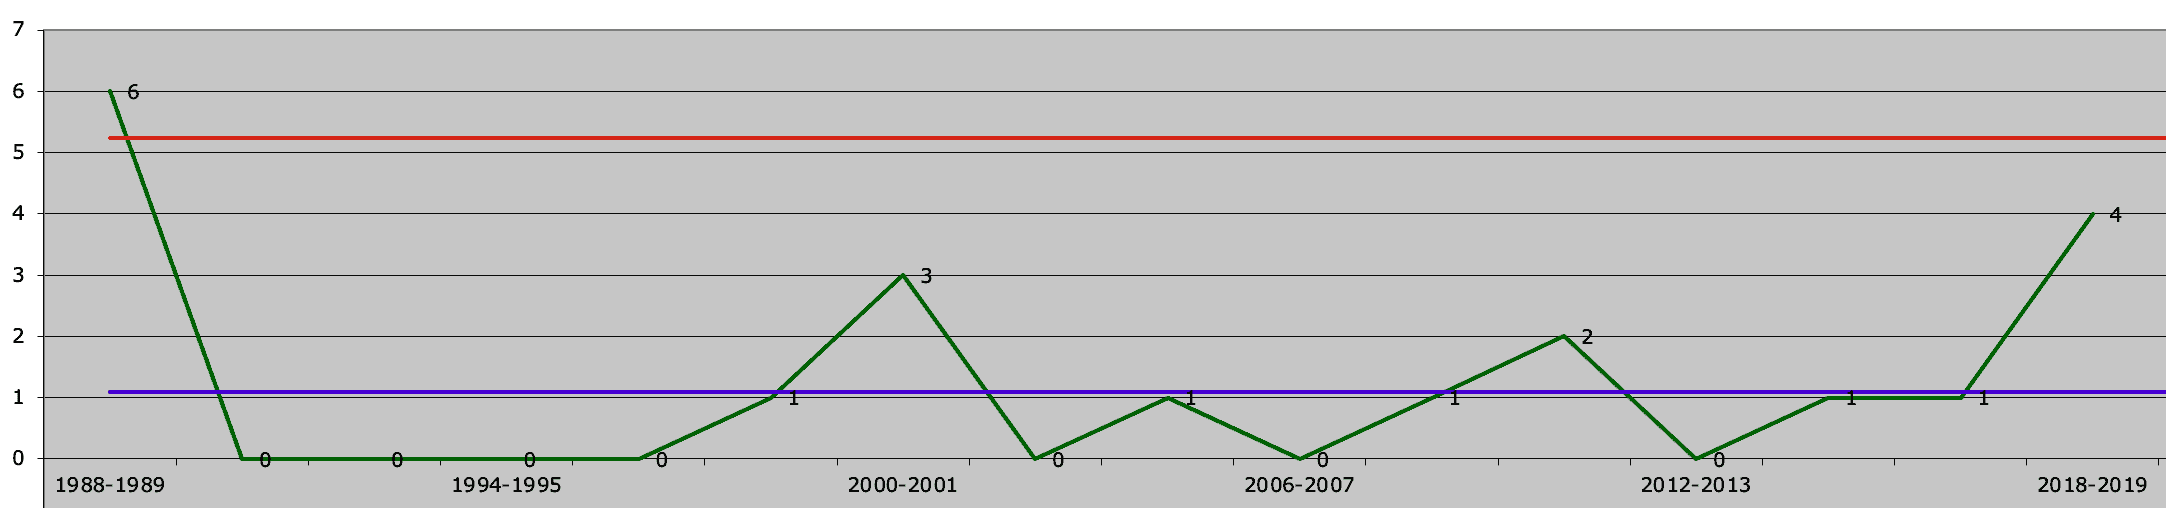
The graph from the report shows the years with PSM major losses. However, if you plot all two-year periods, you notice that many years don’t have any “top 20 losses” in the last 30 years accidents.
When you plot all the data (including the years with zeros) on a Process Behavior Chart, you see that 1988-1989 was abnormal with six of the most expensive accidents but that every year since then is within the normal variation (0 to 5 major accidents). But keep reading because even this trend might be a false trend.
I would rather plot this data on a graph of time between accidents on a Process Behavior Chart if I had the dates.
Also, counting major accidents from around the world is a tremendous amount of averaging of performance. The six accidents in a two-year period might just be a coincidence. For example, if you shifted the two-year periods by a year, you might have 2 incidents in one two-year period and 4 incidents in the next.
For more about trending, see:
More Info Major Accidents
Click on the…
button to get more information about the statistics, causes, and other data about the accidents in this report.
Learn How to Investigate Process Safety Accidents
Use the world’s leading root cause analysis system – TapRooT® – to investigate process safety incidents/accidents. W#here? At the 5-Day Advanced Root Cause Analysis Team Leader Course. When are these courses? See:
https://store.taproot.com/5-Day
Or have a course at your site. CONTACT US to get a quote.
Don’t wait! You want to learn from precursor incidents to avoid major accidents. The 5-Day TapRooT® Course can teach you how.